

Most SEO reports show numbers but do not explain what those numbers mean. A client may see traffic go up or down and still ask what actually happened. A good monthly SEO report should answer that question.
It should show:
- What changed
- Why it changed
- What the change means
- What you should do next
This guide explains what to include in a monthly SEO report, how to structure it and how to turn SEO data into useful insights. You will also find a free monthly SEO report template at the end.
What Is a Monthly SEO Report?
A monthly SEO report is a summary of how a website performed in organic search during the past month.
It includes:
- Organic traffic
- Keyword rankings
- Google Search Console clicks and impressions
- Click-through rate
- Leads and sales
- Backlinks
- Technical SEO health
- AI search visibility
The report should also compare results with an earlier period.
For example:
- This month vs last month
- This month vs the same month last year
A dashboard and an SEO report are not the same thing and they serve different purposes as well. A dashboard shows performance data and on the other hand, an SEO report explains what changed, why it changed and what action should be taken next.
Why Monthly Reporting Cadence Works
A monthly reporting cadence works well because SEO results take time. But Weekly reports can make small changes look more important than they are, which is not necessary to take into account. A quarterly reporting cadence becomes too late because you can miss a lot of things within this period.
That is why, as part of our SEO Retainer Service, we provide a comprehensive monthly SEO report with individual weekly performance tracking. This approach gives you the bigger picture of your monthly SEO progress while also allowing you to clearly monitor what happened each week.
A monthly SEO report gives you with sufficient data so that you can identify what is going well and what aspect is not. If, for example, traffic to your website, individual positions or the number of inbound leads begins to decline, you may be able to diagnose the problem early and put in a change before it escalates into a major issue:
Monthly reporting also helps with three things, including accountability, budget justification and strategy changes.
Accountability
A monthly report shows what your SEO team completed.
You can list:
- Pages published
- Pages updated
- Technical issues fixed
- Links earned
- Titles improved
- Redirects added
This makes the work easier to track.
Budget Justification
SEO often needs an ongoing budget. A monthly report helps show what that budget produced. Do not report traffic only. Connect SEO work with leads, sales, pipeline or another business goal whenever possible.
Strategy Changes
Monthly reporting helps you find problems early. Maybe a service page lost clicks. Sometimes an important keyword drops in rankings or impressions increase but leads fall. You can find the problem and change the strategy before another quarter passes.
Weekly checks still make sense during a site migration, a major ranking drop or a new website launch. But the formal SEO report should stay monthly.
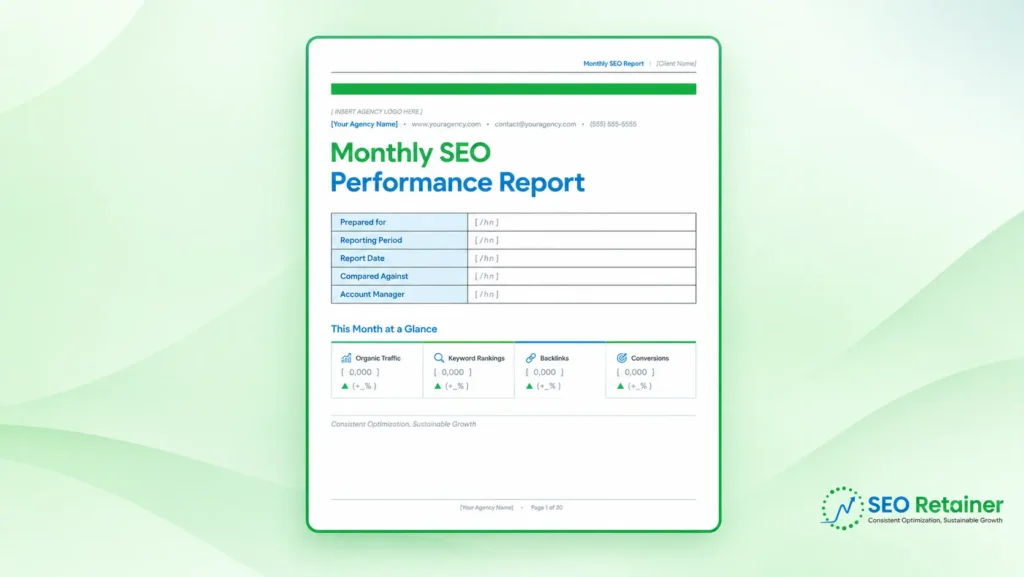
Free Monthly SEO Report Template
In the space below, we have prepared a free monthly SEO report template you can use as a reference. It will enable you to consolidate your main metrics, conclusions, and action plans in one document. It’s fully customizable and based on factors like your website, goals and required reports.
Core KPIs Every Monthly SEO Report Should Include
You do not need 50 metrics to measure performance. Too many numbers make the report harder to read. For most websites, these eight KPI groups cover the main story.
Organic Traffic & Sessions
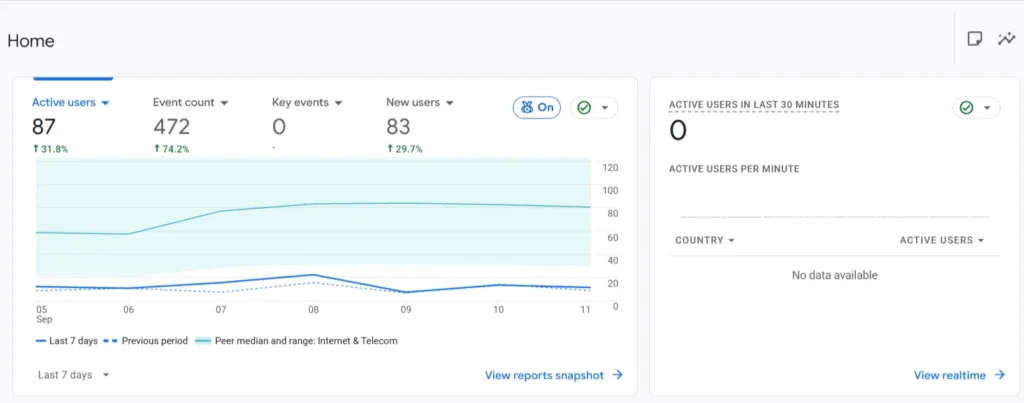
Start with organic traffic and track GA4 users and sessions from organic search. But do not rely only on one sitewide number.
Break traffic down by:
- Landing page
- Device
- Page type
- Location when useful
A 10% traffic increase sometimes looks good, but one blog post could be creating most of that growth while your service pages lose visitors. It also helps to separate blog traffic from product or service-page traffic. They often have different goals. Find the pages that caused the biggest increase or drop. A few URLs often explain most of the change.
Keyword Rankings & Visibility
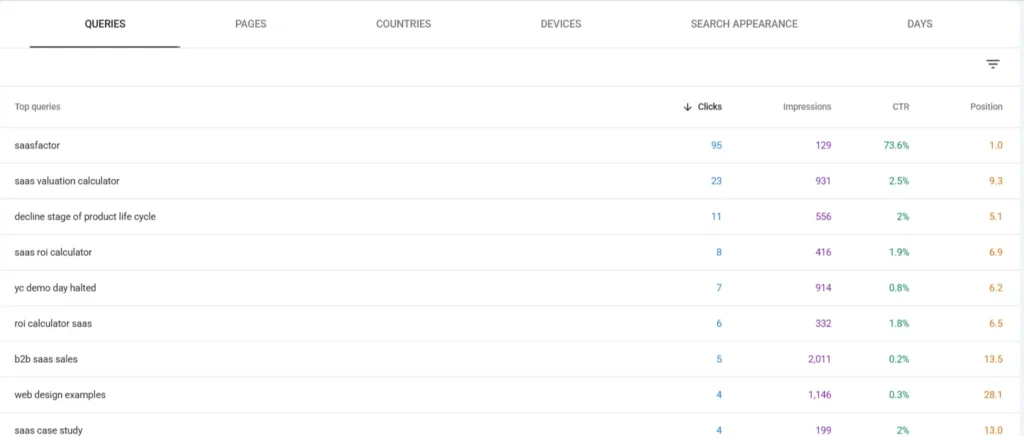
You do not need to track every keyword your site ranks for. Pay more attention to the terms that can actually bring in leads or sales, especially commercial and transactional keywords. For example, if your rank drops from position 2 to 9 for an important service-related keyword, it definitely will hurt more than an informational keyword’s rank drop.
Group keywords by search intent and topical cluster, and separate branded terms when useful. That makes it easier to see where visibility is improving and where it is slipping. You can use a visibility score for the bigger picture, but still check the actual keyword positions behind it.
Clicks & Impressions
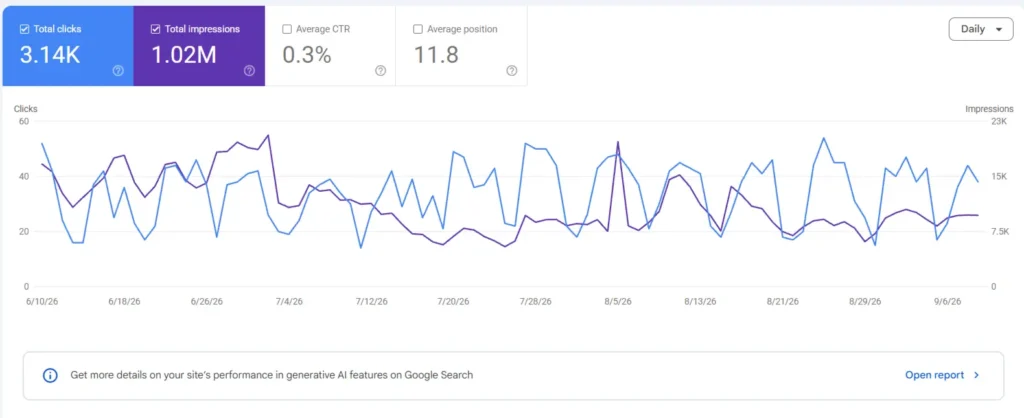
Google Search Console (GSC) gives you clicks and impressions.
- Impressions show how often your pages appeared in Google Search.
- Clicks show how often people clicked.
Read both together. For example, impressions can rise while clicks stay flat. That means your site is gaining visibility, but clicks are not growing at the same rate.
Also compare the same number of days when possible. February has fewer days than January, so the raw totals may look lower even when performance is stable.
Click-Through Rate (CTR)
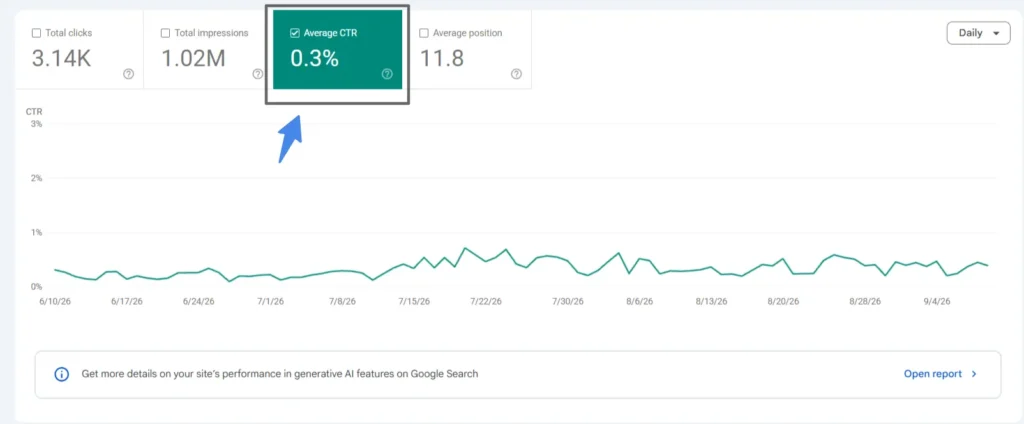
Click-Through Rate
CTR shows how often people clicked after seeing your search result.
Use: CTR = Clicks / Impressions * 100
Do not report sitewide CTR only; you should check CTR by page and query. Always read CTR alongside keyword rankings. If a page stays at position four but CTR falls, something else may have changed.
For example:
- A competitor improved its title
- More ads appeared
- A larger SERP feature appeared
- Google showed an AI Overview
This gives you a better clue about what happened.
Organic Conversions & Revenue
This is one of the most important parts of the monthly SEO report.
Track actions such as:
- Form submissions
- Phone calls
- Demo requests
- Sign-ups
- Purchases
- Qualified leads
Also report conversion rate and key events. For example:
- 35 organic leads
- 1000 organic sessions
- 3.5% conversion rate
Where possible, connect SEO with revenue or pipeline. For a lead generation business, estimate value using the company’s real close rate and average deal value. Always label estimates clearly. Do not present your own calculation as research.
Backlink Profile Changes
Do not report only the total backlink count because one referring domain can generate many backlinks. Referring domains usually give a cleaner picture.
Track:
- New referring domains
- Lost referring domains
- Net change
- Important links earned
- Link relevance
If your team earned strong links through outreach or digital PR, mention the best examples. The goal is to show useful authority growth, not just a bigger link number.
Technical Health
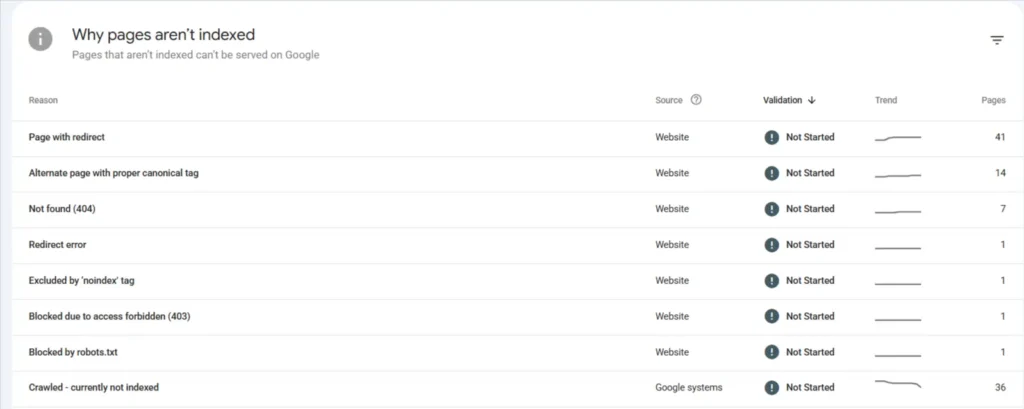
Technical Health
Technical SEO can affect crawling, indexing and rankings.
Your monthly report may include:
- Core Web Vitals
- Crawl errors
- Indexing issues
- Broken pages
- Redirect problems
- Sitemap issues
- Pages blocked from search
Also check which important pages are indexed or excluded. Keep this section simple for non-technical readers.
Explain:
- What the issue is
- Why it matters
- What you fixed
- What still needs work
Put deeper technical detail in an appendix if needed.
AI Search Visibility
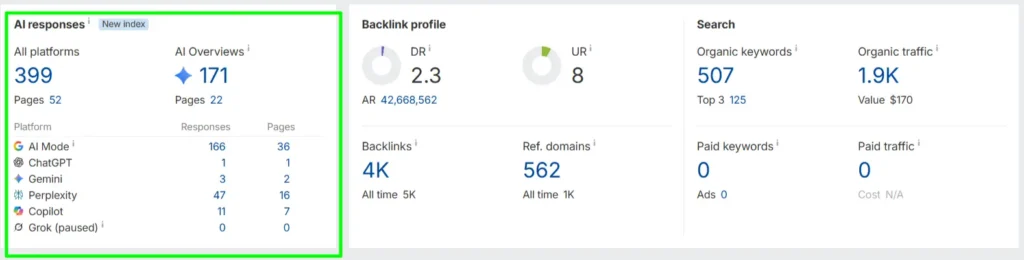
AI search is now another part of search visibility. AI answers can appear above or alongside normal search results. Track whether your brand or pages appear in:
- Google AI Overviews
- Google AI Mode
- Copilot Search in Bing
- Other important AI search tools
You can also track AI visibility and this is how often your brand or website appears across a tracked group of AI answers compared with competitors.
To give a practical example, when 20 of the 100 AI results that are being tracked feature your brand and another competitor is found in 35 of those 100, the competitor has a bigger visibility across that set of results.
Besides, generative AI performance data about AI Overviews and AI Mode can also be found using Google Search Console, which you can use to check how many times different pages, devices, and countries showed up (impressions) based on the visibility they had.
How to Structure a Monthly SEO Report (Template Breakdown)
A simple monthly SEO report can use eight main sections:
- Executive summary
- Traffic
- Rankings
- Conversions and business impact
- Technical health
- Backlinks
- Work completed
- Insights and next month’s action plan
Put the most important information first. Business results should come before complex SEO details.
Executive Summary
Write this section last and place it first. Keep it short. Three to five sentences are usually enough.
Answer:
- What has improved?
- What dropped?
- Why?
- What happens next?
Avoid too much SEO jargon. If a client reads only this section, they should still know where they stand.
Traffic Section
Show month-over-month and year-over-year performance.
For example:
| Metric | This Month | Last Month | MoM | Last Year | YoY |
|---|---|---|---|---|---|
| Organic Sessions | 12,450 | 11,620 | +7.1% | 10,980 | +13.4% |
| Organic Users | 9,180 | 8,760 | +4.8% | 8,320 | +10.3% |
Both comparisons matter. A month-over-month drop looks bad until you see the same seasonal pattern that happened last year. You can add one short sentence explaining the biggest change.
Rankings Section
Use a simple keyword table with:
- Keyword
- Current position
- Change
- Search volume
- Ranking URL
Show the biggest wins and losses first. Do not place hundreds of keywords in the main report and keep the longer list in an appendix.
Conversions & Business Impact
Show what SEO is actually doing for the business. That could mean leads, calls, sales, demo requests, revenue or conversion rate.
Then look at what changed. If traffic stayed about the same but leads dropped, the problem may not be SEO visibility. It could be the page itself, the offer or the path people take before converting.
Technical/Site Health
Your first job here is to list issues found, issues fixed and issues still open. For open problems, add an owner and due date when possible. This stops technical issues from sitting in the report for months.
Backlinks & Off-Page
Show:
- New referring domains
- Lost referring domains
- Net change
- Best new links
Explain why the strongest new links matter. Relevance and quality usually matter more than raw volume.
Work Completed This Month
Show what the SEO team completed during the month.
For example:
- Published 4 pages
- Updated 6 old pages
- Improved 10 title tags
- Fixed 15 broken links
- Added redirects
- Improved internal links
- Earned new referring domains
These numbers show the client a clear record of completed SEO work.
Insights & Next Month’s Action Plan
End with three to five clear actions. Each action should connect to something found earlier in the report.
- Do not write: Improve content.
- Write: Update the two service pages that lost the most clicks and add stronger internal links.
The second version tells the reader what you will do and why. Carry these actions into next month’s report and mark them completed or still open.
Turning Data Into Insight: The “So What” Layer
Data tells you what happened. Insight explains why it happened and what to do next.
- For example: Organic clicks dropped by 18%. That is data.
- Now explain it: Organic clicks dropped by 18% because two high-traffic guides lost rankings.
- Then add the action: We will update both guides and improve their internal links next month.
Now the report becomes useful. So, after every important number, ask the questions below, adding context to them.
- Why did this happen?
- What should we do next?
Seasonality
Most businesses face busy and slow months, so traffic naturally rises and falls throughout the year. So you should compare YoY before saying it is a problem.
Algorithm Updates
If Google confirms a major update during the reporting period, mention it when relevant. Do not blame every ranking change on an update.
Benchmarks
Historical data can give useful context. For example, a 2% conversion rate sounds weak. But if the site was at 1.1% six months ago, the trend looks much better. A simple rule can keep your report focused. If a metric does not help you make a decision, you may not need to include it.
Stop Making These Monthly SEO Reporting Mistakes
A few common mistakes can make an SEO report harder to understand and less useful.
Too Many KPIs
A report with a lot of charts can feel like homework. Instead, choose the metrics that clearly show what changed and help you decide what to do next.
Vanity Metrics With No Business Tie-In
Metrics like impressions and average position can be useful, but they need context. For example, a 40% increase in impressions is not necessarily good news if clicks stayed flat and leads went down.
No Comparison Baseline
A number by itself means very little. For example,
Organic traffic: 12000 sessions.
Now compare it,
Organic traffic: 12000 sessions, up 14% MoM and 22% YoY.
The second version gives useful context.
All Data, No Narrative
Do not make the client study charts and guess what happened. Instead, explain the story. For example, impressions increased by 40%, but clicks stayed flat and demo requests fell. Most new visibility came from broad informational searches while buying terms lost rankings. The numbers are the same, but now the reader knows what they mean.
Tools to Automate Monthly SEO Reporting
Creating the same SEO report manually every month can take a lot of time. Reporting tools can pull data, update charts and reduce repetitive work. However, each tool is better suited to a different reporting need.
Google Looker Studio vs Semrush vs Ahrefs vs DashThis vs SE Ranking
| Tool | Best For | Main Strength | Main Limit |
|---|---|---|---|
| Google Looker Studio | Custom reports | Flexible dashboards using connected data | Can take time to set up |
| Semrush | SEO reporting | Combines rankings and other SEO data | May offer more features than small teams need |
| Ahrefs | SEO research | Strong backlink and organic search data | Less focused on complete reporting dashboards |
| DashThis | Client reporting | Brings data from multiple sources into one report | Relies on other tools for deeper SEO analysis |
| SE Ranking | Agencies and teams | Rank tracking with built-in reporting | Offers less flexibility than a fully custom dashboard |
Before choosing any of the above tools, check their current features, pricing and integration availability. Automation of working processes definitely reduces manual work and reduces the time spent collecting and copying data, but it cannot replace analysis. You still need to explain what changed, why it happened and what actions should come next.
When to Build Manually vs Automate
Start with a manual report while you are still deciding what to include. Once the format is stable, automate the repetitive parts.
| Build Manually When | Automate When |
|---|---|
| Your template is still changing | Your template is stable |
| You manage a few sites | You manage many sites |
| You need custom notes | You pull the same data every month |
| You are still choosing KPIs | Your KPI list is fixed |
| Analysis takes most of the time | Copying data takes too much time |
Start manually, improve the template, then automate the repeated work. Keep the executive summary, insights and action plan human-led. Automation should save time on data collection, not replace your judgment.
Free Monthly SEO Report Template
In the space below, we have prepared a free monthly SEO report template you can use as a reference. It will enable you to consolidate your main metrics, conclusions, and action plans in one document. It’s fully customizable and based on factors like your website, goals and required reports.
FAQ
How often should I report on SEO?
There is no single reporting schedule that works for every SEO campaign. But the most suitable time is monthly SEO reporting because weekly shows too many changes, which are unnecessary and, on the other hand, quarterly reports are too late to make a decision in some cases. So monthly reporting stands out of all three reporting cycles.
What’s the difference between an SEO report and an SEO audit?
An SEO report shows how a website performed over a specific reporting period. It highlights what changed, the extent of changes achieved, and the problems that remain unchecked. Most SEO consultants usually deliver these reports on a certain period basis, usually monthly or quarterly. An audit is different. It takes a deeper look at the site to find technical, on-page, content and other SEO problems. It is usually done when the site needs a full review rather than as part of regular reporting.
What KPIs matter most for small businesses vs. enterprise?
Small businesses care most about leads, calls, conversions, local visibility, organic traffic and a focused set of priority keywords. Enterprise sites need more detailed tracking. That means traffic by market, share of voice, indexation and revenue by page type.
Should AI Overview visibility be tracked monthly?
Yes, if AI Overviews show up for searches that matter to your business. Check whether your pages appear more or less often. Then compare that with clicks, conversions and other results to see if the visibility actually helps.